soccer
How Our Soccer Predictions Work: BXS, Draws, and 10,000 Simulated Seasons
From a chess rating system to forecasting relegation across 34 leagues.
Greg Lamp · February 24, 2026
Features / SOCCER
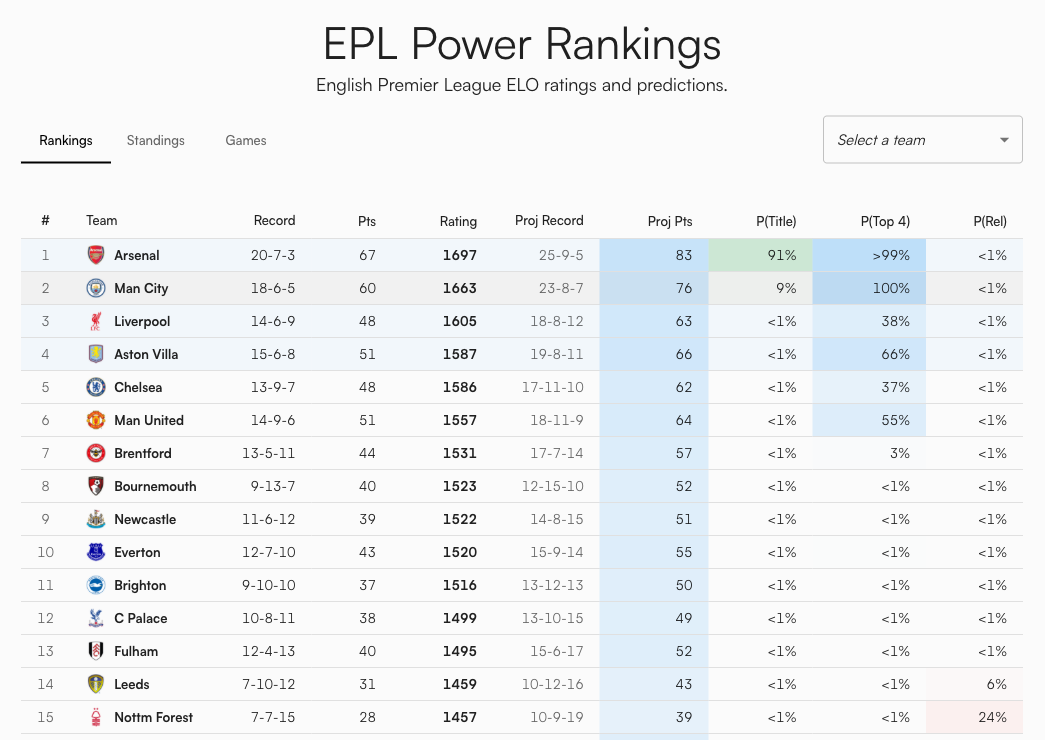
I check the EPL rankings table every morning with coffee. Last Tuesday, I saw something that made me put the mug down: Tottenham Hotspur, a club that finished in the top 6 for roughly a decade straight, sitting in the bottom three with five consecutive losses. The model gave them a 27% chance of relegation. Spurs. Relegated. That number felt absurd and completely reasonable at the same time.
That's what a good prediction model should do. Not just confirm what you already know, but force you to confront what the math actually says. The original Boxscorus model only covered MLB. But after FiveThirtyEight shut down and took the best public soccer predictions with it, I wanted to fill the gap. So I built a BXS system that covers 34 soccer leagues, from the Premier League to the Chilean Primera, with three-way match probabilities and full season simulations.
This post explains how all of it works under the hood.
So What Happens When You Build a Chess Rating for Soccer?
ELO ratings were invented for chess. Two players, one winner, one loser. The formula is clean: after each game, the winner gains points and the loser loses them, scaled by how surprising the result was. A grandmaster beating a club player? Tiny adjustment. A club player beating a grandmaster? Massive swing.
Soccer has a problem chess doesn't: draws. About 26% of Premier League matches end level. That's roughly one in four games where nobody wins. A naive ELO system treats a draw as half a win for each side. That works for updating ratings, but it can't actually predict how often draws happen. And if you want to forecast league tables (where a draw gives 1 point and a win gives 3), you absolutely need draw probabilities. A model that says "55% home, 45% away" is leaving money on the table when the true split is "42% home, 26% draw, 32% away."
A Statistician in 1970 Already Solved This
The fix comes from Roger Davidson, who published "On Extending the Bradley-Terry Model to Accommodate Ties in Paired Comparison Experiments" in the Journal of the American Statistical Association (1970, vol. 65, no. 329). A 2020 paper in JQAS later showed that the standard Elo algorithm silently assumes a 50% draw rate, which is absurdly wrong for any sport. Davidson's model fixes this with a single parameter.
The core insight: the probability of a draw is proportional to the geometric mean of the two teams' win probabilities. Two evenly matched teams? High draw chance. A massive favorite against a minnow? Draws become rare.
Here's the actual formula:
draw_prob = 2 * sqrt(p_home * p_away) * DRAW_MARGIN / (1 + DRAW_MARGIN)
DRAW_MARGIN is set to 0.36, which produces a ~26% draw rate for evenly matched teams. That lines up almost exactly with historical EPL data. The remaining probability mass gets split between home and away wins, scaled by the original two-way BXS prediction.
Three probabilities. Always sum to 100%. Home win, draw, away win.
Six Parameters Run the Whole Thing
The full model has six numbers, calibrated against four seasons of historical data (~1,500 matches per league):
| Parameter | Value | What it does |
|---|---|---|
| K-factor | 20 | How much a single result moves BXS. Higher = more reactive. |
| Home advantage | 65 pts | Added to the home team's BXS before computing probabilities. |
| Draw margin | 0.36 | Controls draw frequency via Davidson's model. |
| Default BXS | 1500 | Starting rating for all teams. |
| Regression factor | 0.33 | Between seasons, ratings regress 33% toward 1500. |
| Promoted team BXS | 1400 | Teams new to a league start below average. |
Why K=20? Soccer has 38 matches per season. Baseball has 162. With so few data points, the model needs to react quickly to new information. A single upset can swing a rating by up to 20 points. That's aggressive by design.
The 65-point home advantage is roughly the gap between the 5th-best and 12th-best teams in the Premier League. Think Arsenal versus Brighton. That's how much playing at home is worth, and it translates to about a 59% expected win rate for a home team facing an equally-rated opponent. Research from Hvattum and Arntzen (2010) found similar home advantage magnitudes when applying ELO to European football.
Season regression is a balancing act. At 0.33, a team rated 1600 ends up at 1567 the next season. Enough to give promoted teams a fair shot, not so much that last year's data becomes worthless.
Three Numbers That Summarize Every Match
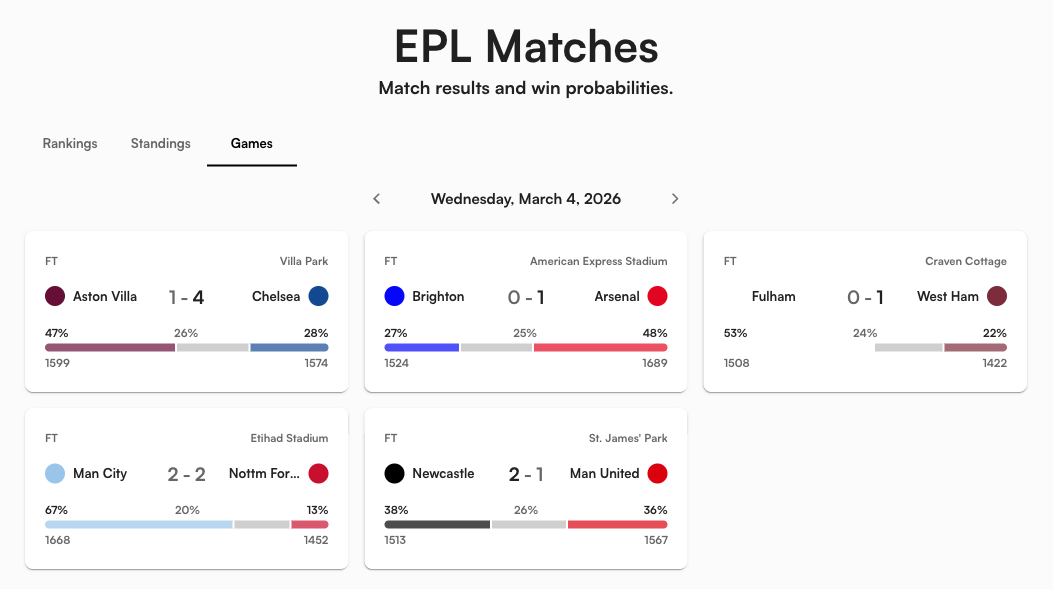
Every match on the site displays a three-segment probability bar. Take Arsenal (BXS 1697) hosting Nottingham Forest (BXS 1457). The model does three things:
- Raw two-way probability: Arsenal's adjusted home BXS is 1697 + 65 = 1762. Against Forest's 1457, the standard Elo formula gives Arsenal ~83% in a head-to-head.
- Draw extraction: Davidson's model pulls out ~16% draw probability (lower than the usual 26% because the BXS gap is so large).
- Final three-way split: Arsenal 70%, Draw 16%, Forest 14%.
The wider the gap, the less likely the draw. Man City vs. Wolves? Maybe 13% draw. Everton vs. Brighton? Closer to 27%. The model handles this automatically through the geometric mean in Davidson's formula.
Where Does My Team Finish? 10,000 Simulated Seasons
A single match prediction is interesting. But the question that keeps people up at night is: are we going down? Will we make Champions League? Is the title race actually over?
To answer that, the model simulates the remainder of every season 10,000 times. Each simulation plays out every remaining fixture using the three-way probability model, flipping a weighted coin for each match. Here's the process:
- Load current state: each team's BXS, points, wins, draws, losses, goal difference.
- Get remaining fixtures: every unplayed match in the actual schedule.
- Simulate each match: use three-way probabilities to determine a result. Update points. Update BXS ratings with a reduced K-factor of 4 (not 20, because simulated results shouldn't swing ratings the way real results do).
- Sort the final table: rank by points, with goal difference plus a noise term as tiebreaker.
- Count outcomes: across 10,000 runs, tally how often each team finishes 1st, top 4, bottom 3.
Why K=4 during simulation instead of K=20? In real life, each result carries genuine information. The model should react strongly. But in simulation, a string of random upsets would cascade into wild BXS swings that make the rest of the simulated season unrealistic. K=4 acknowledges that team strength drifts slightly over time without overreacting to noise.
What Does 91% Title Odds Actually Mean?
The rankings table has four columns derived from those 10,000 simulations:
- Proj Pts: average final points. Arsenal at 83 means the model's best guess for their final tally.
- P(Title): percentage of sims where the team finishes 1st. Arsenal's 91% means 9,100 out of 10,000 simulations.
- P(Top 4): percentage of sims in a Champions League spot. Man City at >99% means they qualified in essentially every simulation.
- P(Rel): percentage of sims in the bottom 3. Wolves at >99% means the model considers them virtually certain to go down.
These numbers shift after every real match. An upset in October ripples through more remaining fixtures than one in May. Early-season surprises compound.
When the Math Becomes Certain
Beyond probabilities, the model computes mathematical clinching flags. These are conservative, points-only calculations. No assumptions about tiebreakers.
The logic: a team has clinched a Champions League spot when fewer than 4 other teams could possibly reach their current point total, even if every remaining result goes against them. The formula counts how many teams have a theoretical maximum (current points + 3 per remaining game) that still exceeds your current total.
This math never produces false positives. It might miss a clinch that depends on head-to-head records or the constraint that two rivals playing each other can't both win. But it will never show a checkmark prematurely. When it does appear, you can trust it completely.
A checkmark replaces the probability percentage. A dash in the relegation column means the team is mathematically safe.
What the Model Found That Surprised Me
I'll be honest: some of these numbers made me double-check the code.
Spurs in the relegation zone. Tottenham have 29 points from 29 games, five straight losses, and the model's 18th-lowest BXS at 1411. The simulation gives them a 27% chance of going down. For context, that's roughly the same probability as rolling a specific number on a four-sided die. Not likely, but not ignorable. A club with Spurs' wage bill in League One would be genuinely bizarre.
Liverpool: 3rd by BXS, 6th by points. Liverpool's BXS of 1605 ranks them 3rd in the league, but their 48 points put them 6th in the actual table. The model thinks they're significantly better than their results show. Their projected record of 18-8-12 suggests the model expects them to perform closer to their underlying quality over the remaining fixtures. If you believe results eventually regress to ability, Liverpool are undervalued by the standings.
Sunderland: the promoted team the model doesn't trust. Sunderland sit on 40 points, comfortably 11th in the league table. But their BXS is just 1457, ranking them 16th. The model has watched them accumulate points but hasn't been convinced by the quality of those results relative to the opposition. Their form of W-D-L-L-L suggests the model might be right to be skeptical.
The Wolves collapse is historically bad. Sixteen points from 30 matches. That's 0.53 points per game. For reference, the worst Premier League season ever (Derby County 2007-08) ended with 11 points from 38 games, a rate of 0.29. Wolves are on pace for roughly 20 points total. Bad, but not record-breaking. The model gives them a 99.9% chance of relegation, which is as close to certainty as 10,000 simulations can get.
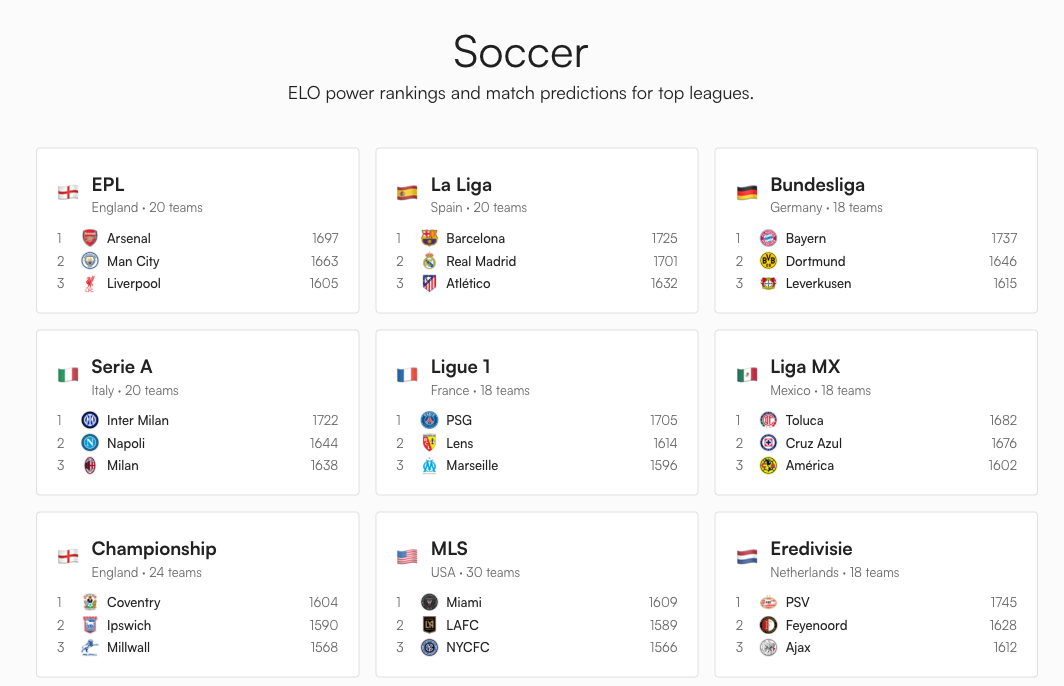
34 Leagues, Same Six Parameters
The exact same BXS engine and Monte Carlo simulation runs across all 34 leagues. What changes per league is the zone configuration: which table positions mean what.
| League type | Example | Zones |
|---|---|---|
| Top European | EPL, La Liga | Top 4 Champions League, 5th-6th Europa, bottom 3 relegated |
| Two-tier European | Bundesliga | Top 4 CL, 16th relegation playoff, 17th-18th auto-relegated |
| Closed league | MLS, Liga MX | Top 9/8 make playoffs, no relegation |
| Lower division | Championship | Top 2 auto-promoted, 3rd-6th promotion playoff, bottom 3 relegated |
| South American | Brasileirao | Top 6 Copa Libertadores, 7th-12th Copa Sudamericana, bottom 4 relegated |
Each zone gets a subtle background tint in the table. Blue for Champions League, green for promotion, red for relegation. You can see at a glance where the fault lines are.
Every Team Has a Season-Long BXS Story
Click any team name and you get the full narrative: a BXS trend chart plus a game-by-game log with the opponent, pre-match rating, win/draw probability, result, and rating change.
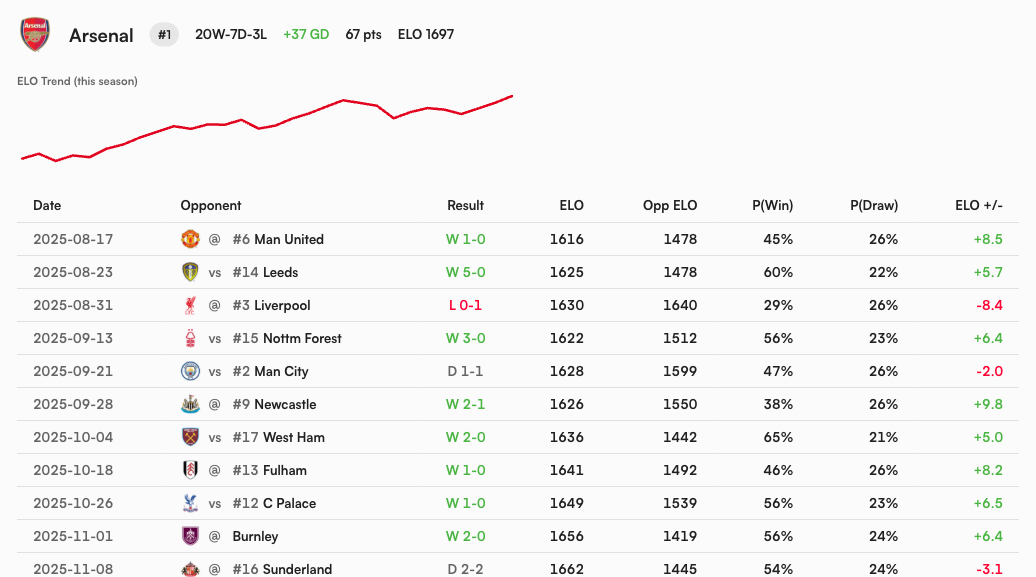
This is where the model explains itself. Arsenal's 0-1 loss at Liverpool cost them 8.4 BXS points because the model only gave them a 29% chance of winning that away match. No surprise, small penalty. Their 5-0 thrashing of Leeds? Only +5.7 points, because the model already expected them to win at 60%. Upsets move the needle. Dominant wins against weak teams barely register.
What the Model Gets Right (and Where It's Blind)
What works: BXS captures relative team strength and updates in real time. The three-way probability model produces draw rates that match historical data. The simulation handles real fixtures, not some generic "play N games against average opposition," so it respects schedule difficulty naturally.
Where it's blind: The model has no idea who's injured, who just signed a 50-million-pound striker in January, or who sacked their manager last week. It treats a 1-0 grind the same as a 5-0 demolition. A team consistently outperforming their xG will be overrated until regression catches them, and a team getting unlucky will be underrated until results improve. I'm genuinely not sure the model handles a newly-promoted team like Sunderland correctly: their BXS still carries the smell of Championship-level football from last season even though their results scream mid-table Premier League.
These are conscious tradeoffs. A model that ingests xG, squad depth, managerial changes, and transfer spend would be more accurate on any single match. But it would also be 10x harder to maintain across 34 leagues. Six parameters and a daily data pipeline from ESPN's public API covers everything from Bayern Munich to the Ecuadorian Liga Pro. That simplicity is a feature, not a limitation.
What to Watch For
The most interesting time to check the model is after an upset. When a mid-table team beats a title contender, watch how the probabilities ripple across the whole table. One result can shift Champions League odds for five or six teams simultaneously, because every match in the simulation window now plays out from a slightly different starting position.
The other thing to watch: clinching flags appearing in March and April. Right now most teams can still mathematically reach most outcomes. By mid-April, checkmarks start locking in, and the model transitions from "what might happen" to "what has happened."
Which brings us back to Spurs. Twenty-nine points from 29 games. Five straight losses. A 27% probability of relegation. That number will move in one of two directions over the next eight weeks. If Tottenham string together a few wins against the bottom half, the model will update quickly (K=20, remember) and that 27% will drop toward single digits. If the losses keep coming, it climbs toward 50%, then higher. By mid-April, we'll know whether that 27% was a false alarm or a prophecy. Either way, the model will have shown its math, every step of the way, with no opinion and no narrative. Just 10,000 simulated seasons and whatever the numbers say.
That's what the soccer predictions page is for. Pick your league. The data updates daily.