soccer
Predicting Soccer Across 34 Leagues: How the BXS Model Handles Draws, Relegation, and 606 Teams
From the Premier League to the Ecuadorian Liga Pro, one model covers them all.
Greg Lamp · February 21, 2026
Features / SOCCER
FiveThirtyEight had the best public soccer predictions on the internet. Club ELO ratings updated daily, season simulations, relegation probabilities. Then they shut down and took all of it with them. No one filled the gap.
So I built one. The BXS model now covers 34 soccer leagues across 21 European competitions, 8 in the Americas, and 5 spanning Asia, Africa, and Oceania. That's 606 teams, from Arsenal to Truro City, all rated on the same scale, all simulated 10,000 times per day. The same six parameters run every league. The same math that predicts whether Bayern Munich clinches the Bundesliga also forecasts relegation battles in the English National League.
The Draw Problem: Why Baseball Math Doesn't Work for Soccer
The Boxscorus MLB model treats every game as binary. One team wins, one team loses. Flip a weighted coin, done. That works because baseball has no draws (extra innings handle ties).
Soccer is different. About 26% of Premier League matches end level, according to historical data from Statista. A model that outputs "55% home, 45% away" is missing a massive chunk of reality. And in a league where draws award 1 point and wins award 3, getting the draw rate wrong cascades through every season simulation.
So the first thing the soccer model needed was a way to predict three outcomes instead of two.
Davidson's Fix From 1970
The solution comes from Roger Davidson, who published an extension of the Bradley-Terry model in 1970 that explicitly handles ties. A 2020 paper in the Journal of Quantitative Analysis in Sports showed that the standard Elo algorithm silently assumes a 50% draw rate, which is wildly wrong for any sport. Davidson's extension fixes this with a single parameter.
The core insight: the probability of a draw is proportional to the geometric mean of the two teams' win probabilities. Two evenly matched teams? High draw chance. A massive favorite against a minnow? Draws become rare, because one side is too dominant.
The formula:
draw_prob = 2 * sqrt(p_home * p_away) * DRAW_MARGIN / (1 + DRAW_MARGIN)
DRAW_MARGIN is set to 0.36, which produces a ~26% draw rate for evenly matched teams. That matches the historical EPL average almost exactly. The remaining probability gets split between home and away wins, scaled by the original two-way BXS prediction.
Three probabilities. Always summing to 100%.
Six Parameters, 34 Leagues
The full model runs on six numbers. No league-specific tuning. No special cases for the Premier League versus the Chilean Primera. Same engine everywhere.
| Parameter | Value | What it does |
|---|---|---|
| K-factor | 20 | How much a single result moves BXS. Higher means more reactive. |
| Home advantage | 65 pts | Added to the home team's BXS before computing probabilities. |
| Draw margin | 0.36 | Controls draw frequency via Davidson's model. |
| Default BXS | 1500 | Starting rating for all teams. |
| Regression factor | 0.33 | Between seasons, ratings regress 33% toward 1500. |
| Promoted team BXS | 1400 | Teams new to a division start below average. |
Why K=20? Soccer leagues have 30 to 46 matches per season, compared to baseball's 162. With so few data points, the model needs to react quickly to each result.
The 65-point home advantage translates to roughly a 59% expected win rate for equally-rated opponents, consistent with Hvattum and Arntzen (2010). Season regression at 0.33 means a 1600-rated team enters the next season at 1567. Burnley gets promoted with a 1400 rating, not 1500, because Championship-quality football is not Premier League-quality football.
What the Numbers Look Like Right Now
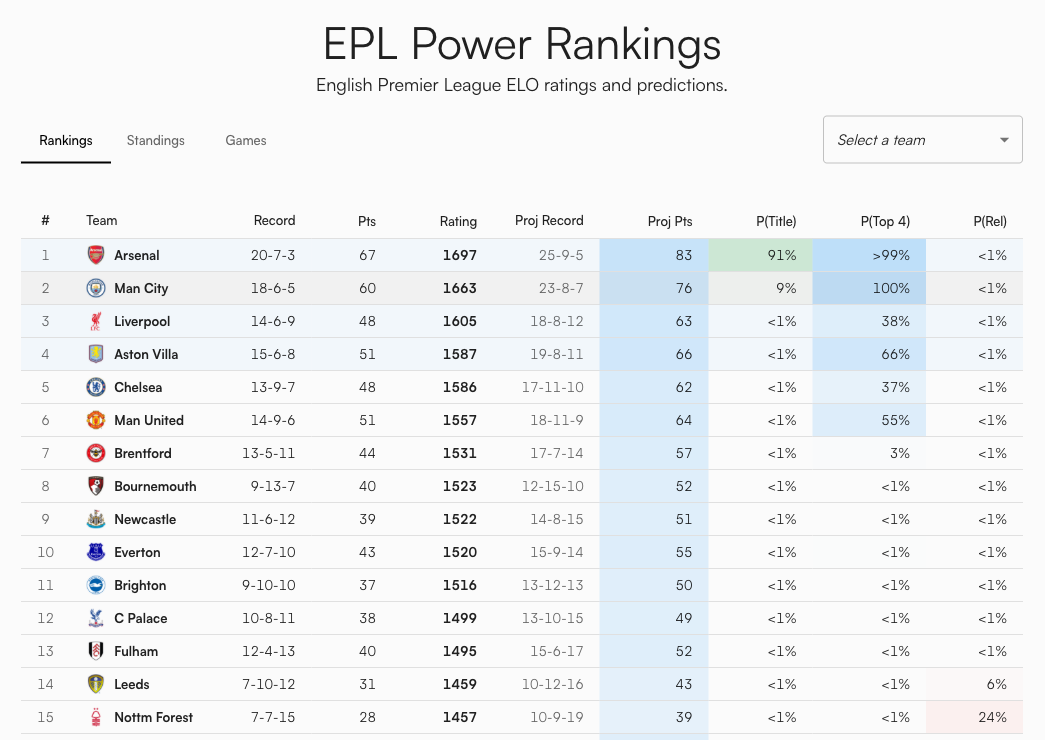
Here's the current EPL table through 30 matches, ranked by BXS rating:
| Team | BXS | Pts | Proj Pts | P(Title) | P(Top 4) | P(Rel) |
|---|---|---|---|---|---|---|
| Arsenal | 1697 | 67 | 83 | 90.8% | >99% | 0.0% |
| Manchester City | 1663 | 60 | 76 | 9.2% | 99.9% | 0.0% |
| Liverpool | 1605 | 48 | 63 | 0.0% | 37.7% | 0.0% |
| Aston Villa | 1587 | 51 | 66 | 0.0% | 66.3% | 0.0% |
| Manchester United | 1557 | 51 | 64 | 0.0% | 55.1% | 0.0% |
| Nottingham Forest | 1457 | 28 | 39 | 0.0% | 0.0% | 24.3% |
| West Ham United | 1435 | 28 | 38 | 0.0% | 0.0% | 43.5% |
| Tottenham Hotspur | 1411 | 29 | 39 | 0.0% | 0.0% | 27.1% |
| Wolves | 1377 | 16 | 25 | 0.0% | 0.0% | 99.9% |
| Burnley | 1356 | 19 | 27 | 0.0% | 0.0% | 99.5% |
Source: Boxscorus BXS ratings and 10,000-season Monte Carlo simulation. Data sourced from ESPN's public API.
Some things that jumped out at me. Liverpool's BXS of 1605 ranks them 3rd in underlying quality, but their 48 points put them 6th in the actual table. The model thinks they're significantly better than their results show. Their projected finish of 18-8-12 suggests regression toward their true ability over the remaining fixtures.
Meanwhile, Tottenham are on five straight losses (form: LLLLL) with a 27.1% chance of relegation. Spurs. Relegated. That number felt absurd and completely reasonable at the same time.
How a Match Prediction Works
Take Arsenal (BXS 1697) hosting Nottingham Forest (BXS 1457) as a concrete example. The model does three things:
- Adjust for home advantage: Arsenal's effective BXS becomes 1697 + 65 = 1762.
- Compute raw two-way probability: The standard Elo formula gives Arsenal ~83% in a head-to-head against Forest's 1457.
- Extract draw probability: Davidson's model pulls out ~16% for the draw (lower than the 26% baseline because the BXS gap is so large).
- Final split: Arsenal 70%, Draw 16%, Forest 14%.
The wider the BXS gap, the lower the draw probability. That's the geometric mean at work. Man City vs. Wolves might produce a 13% draw chance. Everton vs. Brighton, where the BXS gap is tiny, could hit 27%.
10,000 Simulated Seasons
A single match prediction is interesting. But the question fans actually care about is: are we going down? Will we make Champions League? Is the title race mathematically over?
The model simulates the remainder of every season 10,000 times. Each simulation plays out every remaining fixture using the three-way probability model. The process:
- Load current state: each team's BXS, points, wins, draws, losses, goal difference.
- Get remaining fixtures from the actual schedule (not a generic "play N games against average opposition").
- Simulate each match with a weighted three-way coin flip. Update points. Update BXS with a reduced K-factor of 4 (not 20).
- Sort the final table by points, with goal difference plus noise as tiebreaker.
- Count outcomes across all 10,000 runs.
Why K=4 during simulation? A random string of upsets at K=20 would cascade into wild BXS swings that make the rest of the simulated season unrealistic. K=4 lets team strength drift without overreacting to noise.
The Zone System: Not Every League Works the Same Way
The Premier League's top 4 qualify for the Champions League and the bottom 3 get relegated. Simple enough. But the Bundesliga sends its 16th-place team to a relegation playoff. The Championship promotes the top 2 automatically and sends 3rd through 6th into what commentators call "the richest game in football." MLS has no relegation at all. The Brasileirao sends 6 teams to Copa Libertadores, 6 more to Copa Sudamericana, and relegates the bottom 4.
The model handles all of this through a zone configuration system. Each league defines which positions mean what:
| League type | Example | What the zones look like |
|---|---|---|
| Top European | EPL, La Liga, Serie A | Top 4 CL, 5th-6th Europa, bottom 3 relegated |
| German system | Bundesliga | Top 4 CL, 16th playoff, 17th-18th auto down |
| Closed league | MLS, A-League | Top 9/6 make playoffs, no relegation |
| English lower tier | Championship | Top 2 promoted, 3rd-6th playoff, bottom 3 relegated |
| South American | Brasileirao | Top 6 Libertadores, 7th-12th Sudamericana, bottom 4 relegated |
Each zone gets a subtle background tint in the table. Blue for Champions League. Orange for Europa. Green for promotion. Red for relegation. You can see the fault lines at a glance.
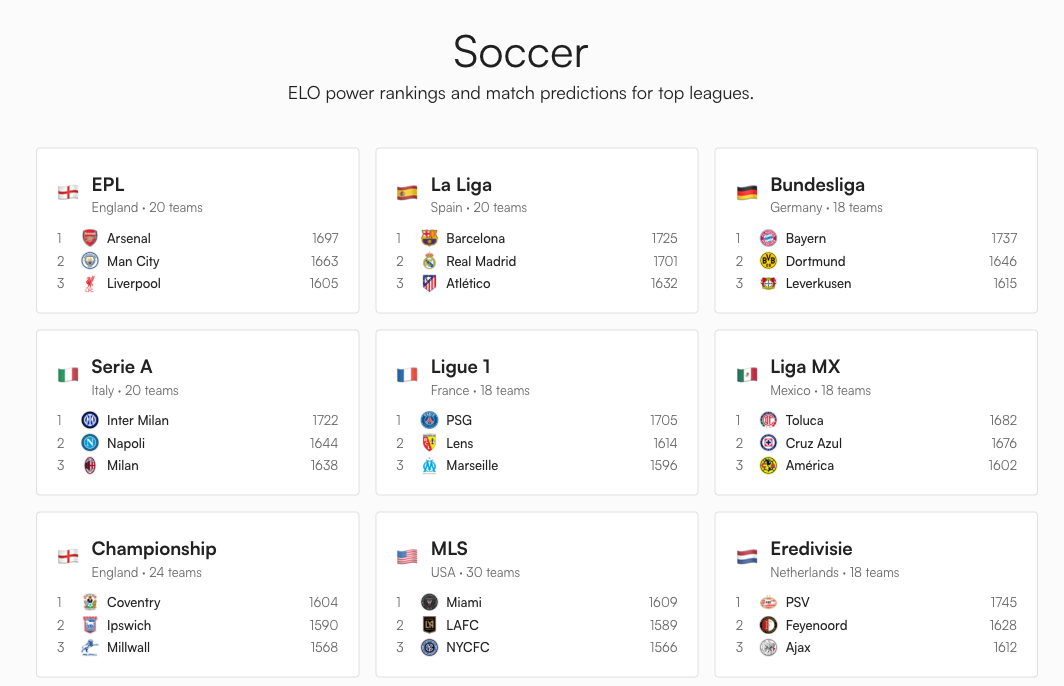
The Global BXS Leaderboard
Because every team worldwide uses the same 1500-point scale, you can compare across leagues. The current top 10 globally:
| Rank | Team | League | BXS |
|---|---|---|---|
| 1 | Galatasaray | Super Lig | 1749 |
| 2 | Sporting CP | Primeira Liga | 1747 |
| 3 | PSV Eindhoven | Eredivisie | 1745 |
| 4 | Bayern Munich | Bundesliga | 1737 |
| 5 | Barcelona | La Liga | 1725 |
| 6 | Internazionale | Serie A | 1722 |
| 7 | Benfica | Primeira Liga | 1721 |
| 8 | FC Porto | Primeira Liga | 1720 |
| 9 | Fenerbahce | Super Lig | 1713 |
| 10 | Mamelodi Sundowns | South African PSL | 1708 |
Source: Boxscorus BXS ratings as of March 2026.
Galatasaray above Barcelona? BXS measures dominance relative to league competition, and it rewards sustained winning. Galatasaray have been demolishing the Turkish Super Lig. Mamelodi Sundowns are to South African football what Bayern is to the Bundesliga. Would Galatasaray beat Barcelona on a neutral pitch? That's exactly what the World Cup model is built for. But within their respective leagues, these clubs are equally dominant.
What the Model Gets Right (and Where It's Blind)
What works well: BXS captures relative team strength and updates daily. The three-way probability model produces draw rates that match historical data across multiple leagues. The simulation handles real fixtures (not synthetic schedules), so it naturally accounts for schedule difficulty. A team with five remaining matches against top-4 opponents will get harder projections than one facing the bottom 5.
Where it's blind: The model has no idea about injuries, transfers, or managerial changes. It treats a 1-0 grind the same as a 5-0 demolition. A team consistently outperforming their xG will be overrated until regression catches them. A newly promoted team like Sunderland (BXS 1457, sitting on 40 points in 16th) still carries some residual Championship-level rating even though their results scream mid-table Premier League.
These are conscious tradeoffs. A model that ingests xG, squad depth, and transfer spend would be more accurate on any single match. But it would also be dramatically harder to maintain across 34 leagues spanning six continents. Six parameters and a daily data pipeline from ESPN's public API covers everything from Bayern Munich to the National League's Truro City (BXS 1314, the lowest-rated team in the system). That simplicity is a feature.
What to Watch For
The most interesting time to check the model is right after an upset. When a mid-table team beats a title contender, watch how the probabilities ripple across the entire table. One result can shift Champions League odds for five or six teams simultaneously, because every simulation now plays out from a slightly different starting position.
The other signal: clinching flags. Right now, most teams can still mathematically reach most outcomes. By mid-April, checkmarks start replacing percentages as teams clinch Champions League qualification or mathematical safety from relegation. The model computes these conservatively (points only, no tiebreaker assumptions), so when a checkmark appears, you can trust it completely.
Pick your league at boxscorus.com/soccer. The data updates daily.