soccer
Simulate the 2026 World Cup in Your Browser
48 teams. 10,000 Monte Carlo simulations. Every click recalculates the entire tournament.
Greg Lamp · March 6, 2026
Features / SOCCER
FiveThirtyEight used to run World Cup forecasts. They'd update probabilities once a day, maybe after each match. You could see numbers change, but you couldn't ask "what if." What if the US loses to Paraguay? What if Saudi Arabia upsets Spain? What if Panama beats Croatia? You just had to wait and see.
I wanted something different for the 2026 World Cup. Not a static forecast. A tool where you click a match result and watch 10,000 simulations recalculate across all 48 teams before you lift your finger off the mouse. So I built one.
Open the World Cup Simulator →
Click a Match, Reshape the Tournament
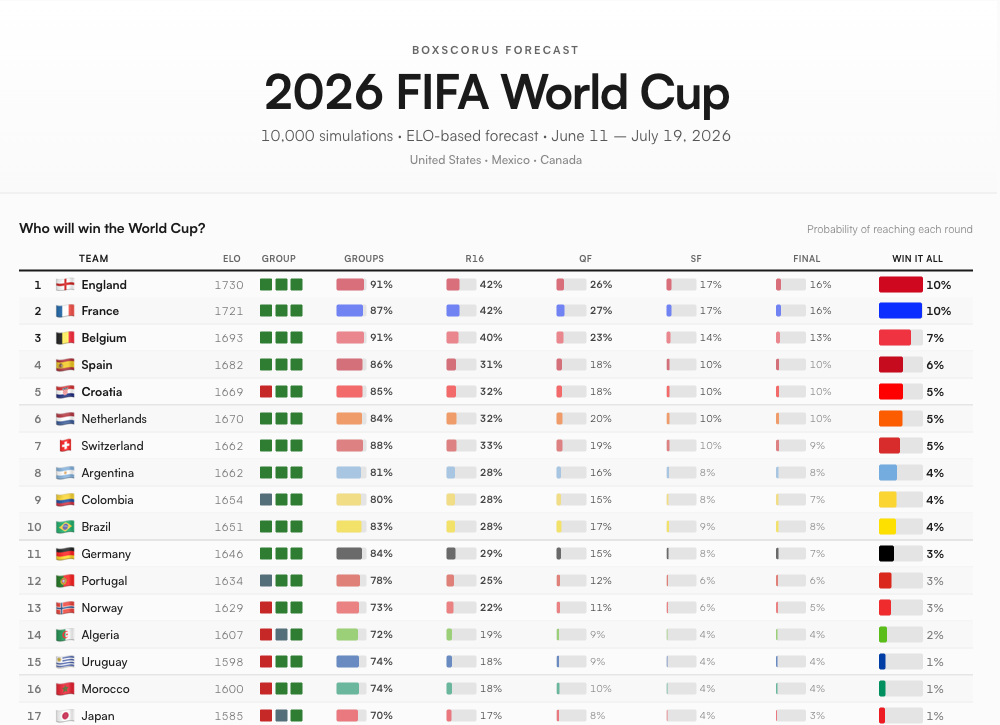
The first thing you see is a probability table: all 48 teams ranked by BXS rating with their chances of advancing through each round and winning the whole thing. Below that, 12 group cards show four teams each with advancement probabilities and colored match squares — green for expected wins, red for likely losses, gray for toss-ups. Below the groups, a full 32-team knockout bracket.
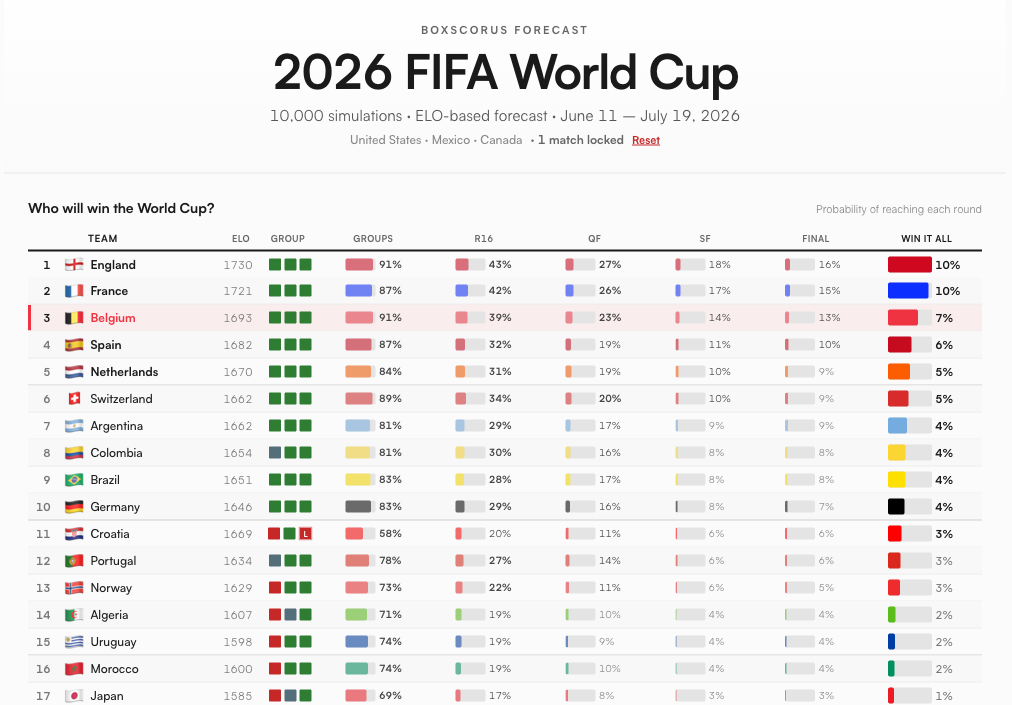
Click any match square and it locks in a result: Win, Draw, or Loss. Click again to cycle through outcomes. Click a third time to unlock it. The moment you lock a result, the simulator re-runs 10,000 Monte Carlo simulations and every number on the page updates — group advancement odds, knockout probabilities, championship chances. Even the knockout bracket reshuffles, because locked group results change who finishes where, which changes who plays whom in the Round of 32 and beyond.
The whole point is building your own scenarios. Lock in the US beating England. Give Saudi Arabia an upset over Spain. Knock out your rival in the group stage. The simulator shows you exactly what those results mean for every team in the tournament.
Three Scenarios to Try
If you want to see the simulator flex, try these:
1. Lock Croatia to lose to Panama in Group L. Croatia drops from 86% advancement to 58%. Their championship odds get cut in half. Panama jumps from 37% to 52%. One click collapses the entire group.
2. Lock Jordan to beat Austria in Group J. Austria falls from 68% to 39%. But the real chaos: Algeria and Argentina, the other two teams in the group, also see significant probability shifts because the points race for second place becomes a three-way pile-up.
3. Lock Saudi Arabia to beat Spain in Group H. Remember Saudi Arabia stunning Argentina 2-1 at the 2022 World Cup? Lock that kind of upset here and watch Spain's title odds drop while Uruguay, Cape Verde, and the Saudis all scramble for the top spots.
It All Runs in Your Browser
There's no server call when you click a match result. The Monte Carlo engine is written in TypeScript and parallelized across your CPU cores using Web Workers. On a typical laptop, 10,000 full tournament simulations complete fast enough to feel instant.
The trick is a pre-computed inverse CDF table for the Poisson distribution. Instead of computing factorials and exponentials for every simulated goal, the engine looks up a random number in a table to get the goal count directly. That optimization, combined with splitting work across multiple workers, made the difference between a sluggish tool and a responsive one. The probabilities animate smoothly between values, team rankings reorder with a FLIP animation, and a flying ELO delta shows you the rating impact of each lock.
Open the World Cup Simulator →
How the Simulation Works
The simulation engine uses a Poisson goal model. Each team's expected goals per match come from the BXS rating difference between the two sides:
| Parameter | Value | What It Controls |
|---|---|---|
| Mean goals per team | 1.3 | Baseline scoring rate (FIFA match data: 2.7 goals/game across the last 5 World Cups, or ~1.3 per side) |
| ELO scaling factor | 600 | How much a rating gap shifts expected goals |
| Draw margin | 0.36 | Davidson's 1970 model for draw probability (~26% for equal teams) |
| Home advantage | 50 pts | Lower than club football (many neutral venues) |
A team with a 100-point BXS advantage scores about 1.5 expected goals vs. their opponent's 1.1 — roughly a 45% win, 27% draw, 28% loss. The Poisson distribution generates actual scorelines (0-0, 2-1, 3-0) for each simulated match, which matter because goal difference decides tiebreakers.
The model uses four competition-weighted K-factors: friendlies (K=15), qualifiers (K=25), continental tournaments (K=30), and the World Cup itself (K=35). A Nations League win moves your rating less than a World Cup win — teams experiment in friendlies and go all-out in tournaments.
The 48-Team Format
This is the first World Cup with 48 teams. Twelve groups of four, where the top 2 plus the 8 best third-place finishers advance to a 32-team knockout bracket. That means 32 of 48 teams (67%) reach the knockouts.
It's actually more punishing than the old 32-team format for a subtle reason. With 12 groups feeding into a fixed bracket, your group finishing position determines your exact bracket placement. The difference between 1st and 2nd in your group can mean facing Portugal in the Round of 16 vs. facing Panama.
England (BXS 1730) in Group L illustrates this perfectly. Finish 1st and they face a third-place qualifier (~1500 BXS) in the Round of 32. Finish 2nd and the fixed bracket slots them against Colombia (1654) or Portugal (1634), then potentially Spain in the R16. England's chance of reaching the quarterfinals: roughly 58% as group winners vs. 35% as runners-up. One group match nearly doubles their path to the QF.
The third-place qualification adds another layer. FIFA uses Annex C rules to assign the 8 best third-place teams to specific knockout slots based on which groups they come from. The simulator handles all 495 possible combinations (C(12,8) = 495) in every simulation run.
Current Odds
Before any matches are played:
| Rank | Team | BXS Rating | Win Group | Win Tournament |
|---|---|---|---|---|
| 1 | England | 1730 | 50.0% | 10.2% |
| 2 | France | 1708 | 45.7% | 9.8% |
| 3 | Argentina | 1662 | 47.7% | 5.8% |
| 4 | Netherlands | 1655 | 39.1% | 5.8% |
| 5 | Colombia | 1654 | 39.2% | 4.1% |
England at 10.2% sounds low for the favorite until you remember there are 48 teams and 4 knockout rounds between the group stage and the trophy. A 1-in-10 shot at that gauntlet is actually strong. The gap between 1st and 5th is only 6.1 percentage points. This is an extraordinarily open tournament — lock in a couple upsets and the whole leaderboard reshuffles.