soccer
How the Boxscorus World Cup Simulator Actually Works
Rate 48 teams, roll real scorelines, and play the whole tournament 100,000 times. Here is the machine, one layer at a time.
Greg Lamp · June 7, 2026
Posts / SOCCER
I built the World Cup simulator because I got tired of arguing about the wrong question. People ask "who's the best team?" as if that settles it. It doesn't. The best team loses all the time, and a 48-team tournament gives them a lot of chances to do it.
Think about what you are actually trying to forecast. Twelve groups, then a knockout bracket, then a champion. Every match has three possible outcomes, and the bracket branches at every round. The number of distinct ways the 2026 World Cup can unfold is astronomically large. No single "who's best" guess can describe that. You cannot eyeball a tree with that many branches.
So the simulator does not guess. It plays the tournament 100,000 times and counts what happens. This is how it works, one layer at a time.
The Fix: Two Layers, a Rating and a Dice Roll
The engine has exactly two jobs. First, rate every team so it knows who is better and by how much. Second, use those ratings to roll the outcome of a match, then chain thousands of those rolls into a full tournament.
Layer one is slow and stable. Ratings are built from years of real results and barely move from one game to the next. Layer two is fast and random. Given two ratings, it produces a scoreline in microseconds, and it produces a different one every time you ask. Stack 64 matches into a bracket, run that bracket 100,000 times, and the randomness averages into probabilities.
Start with the rating.
Layer One: Rate Teams by How Much the Game Mattered
The rating is an international football ELO system. Win and your number goes up. Lose and it drops. The size of the move depends on how much the match mattered, controlled by a competition-weighted K-factor.
| Match type | K-factor | Why |
|---|---|---|
| Friendly | 15 | Rotated squads, low stakes |
| Qualifier / Nations League | 25 | Real lineups, real points |
| Biennial regional (AFCON, Gold Cup) | 15 | Frequent, uneven fields |
| Continental (Euros, Copa, Asian Cup) | 30 | Best-on-best, every four years |
| World Cup | 35 | The biggest results count most |
Beating Brazil in a World Cup knockout (K=35) swings your rating more than twice as hard as beating them in a March friendly (K=15), and that is correct. Teams experiment in friendlies and go all out in tournaments, so the model trusts tournament results more.
Two other knobs finish the rating. Home advantage is worth 50 ELO points, lower than club football because so many international games are at neutral sites. And between tournament cycles, ratings regress 10% toward the mean of 1500, a roughly seven-year half-life. National rosters turn over slowly, so the model keeps ratings sticky instead of resetting them.
Soccer Has a Third Outcome: The Draw
Before any match can be rolled, the model has to handle something baseball and basketball never deal with. Those sports cannot tie. Soccer ties constantly, close to a quarter of evenly matched games.
A plain ELO only knows win probability. It has no slot for the draw, so it quietly mismodels every tight match. The fix is Davidson's 1970 paired-comparison model, which carves out a third outcome with one tunable knob. The model sets that draw margin at 0.36, producing about a 26% draw rate between equal sides. Get it wrong and your group tables drift from reality. Get it right and a 1-1 nobody expected reshapes a group, exactly like the real thing.
Layer Two: Simulate the Score, Not Just the Winner
A coin flip tells you who wins. It says nothing about the score. That gap is fatal in the group stage, where standings break ties on goal difference first, then goals scored. You cannot rank a group correctly without actual scorelines.
So the model rolls goals with a Poisson process. Each team's expected goals scale off the rating gap:
| Parameter | Value | What it controls |
|---|---|---|
| Mean goals per side | 1.3 | Baseline scoring rate |
| ELO scaling factor | 600 | How a rating gap bends expected goals |
| Goal multiplier | exp(elo_diff / 600) | The favorite's scoring boost |
| Home goal bump | +0.1 | Small edge in non-neutral group games |
Numbers in the abstract are easy to nod along to and hard to actually picture. So let me run one match through the whole machine.
Follow One Match: Spain vs Switzerland
Take Spain (ELO 1789) against Switzerland (1612) at a neutral venue, so no home bump. Here is every step the engine takes.
1. Measure the gap. Spain is 177 rating points ahead.
2. Turn the gap into expected goals. The multiplier is exp(177 / 600) = 1.34. So Spain's expected goals are 1.3 × 1.34 = 1.75, and Switzerland's are 1.3 ÷ 1.34 = 0.97. The better team is favored to score more, but not by a blowout margin.
3. Roll the dice. The engine draws each team's goal count from a Poisson distribution around those expected values. Poisson is lumpy, so this is genuinely random. In this particular run, say it comes up Spain 2, Switzerland 1.
4. Record what matters. That 2-1 gives Spain 3 points, a +1 goal difference, and 2 goals scored. Those three numbers feed straight into the group tiebreakers.
5. Remember it is one roll, not the truth. Run this same match thousands of times and Spain wins 55.7%, draws 23.5%, and loses 20.8%. Even a clear favorite at neutral goes home unhappy one time in five. That one-in-five is the entire reason the trophy is hard to predict, and it only shows up because the model rolls the match instead of declaring a winner.
Follow One Tournament: Group Stage to Final
One match is a single roll. A tournament chains them. Here is how the engine plays all the way through once.
Group stage. Each of the 12 groups has four teams playing a round robin, six matches per group. The engine rolls every match with the Poisson model above, then sorts each group by points, then goal difference, then goals scored. The top two in every group advance.
The eight best thirds. This is the new 48-team wrinkle. The 12 third-place teams go into a pool, and the eight best of them also advance. That fills the bracket to 32 teams. The model evaluates all 495 ways those eight slots can be assigned (that is C(12,8)) every single run, because which third-place teams survive changes who plays whom.
Knockouts. From the Round of 32 onward, the engine rolls the same Poisson match, with one extra rule: nobody advances on goal difference. If 90 minutes end level, a penalty-shootout model decides it, a weighted coin flip where the better-rated team gets a slight edge. Somebody has to win. That is why even great teams bleed probability late, because every knockout round is another flip they have to survive.
Ratings drift as the run goes. Most simulators freeze every rating at kickoff. This one does not, and it is the choice I would defend hardest. After each decisive knockout result, the winner's rating ticks up and the loser's down, using a small in-run K-factor of 12. Two evenly matched teams each have a win expectation of 0.5, so the winner gains 12 × (1 − 0.5) = 6 points and the loser drops 6. A team grinding through the bracket gets microscopically stronger as it goes.
Why bother? Because real tournaments have streaks, and a frozen-rating model erases them. It treats Croatia reaching back-to-back finals as pure luck. The effect compounds, which is the whole point. An underdog that pulls off two upsets has clawed back about 12 rating points (6 per win), so its next match tilts a little more its way, and the round after that more still. A favorite that scrapes through on penalties gets no bump at all, because a draw moves nobody. Stack those small per-round swings across a five-round bracket and the math quietly makes long runs less rare than a frozen model allows. That is what fattens the tails of the distribution: more Cinderella runs, more favorite collapses, which is what actually happens at World Cups. I will be honest that this is a modeling choice, not a law of nature. Turn it off and the favorites look a touch safer and the long shots a touch deader.
Play that whole chain once and you get one champion. The single run tells you almost nothing. So the engine does it 100,000 times.
Run It 100,000 Times: What the Engine Outputs
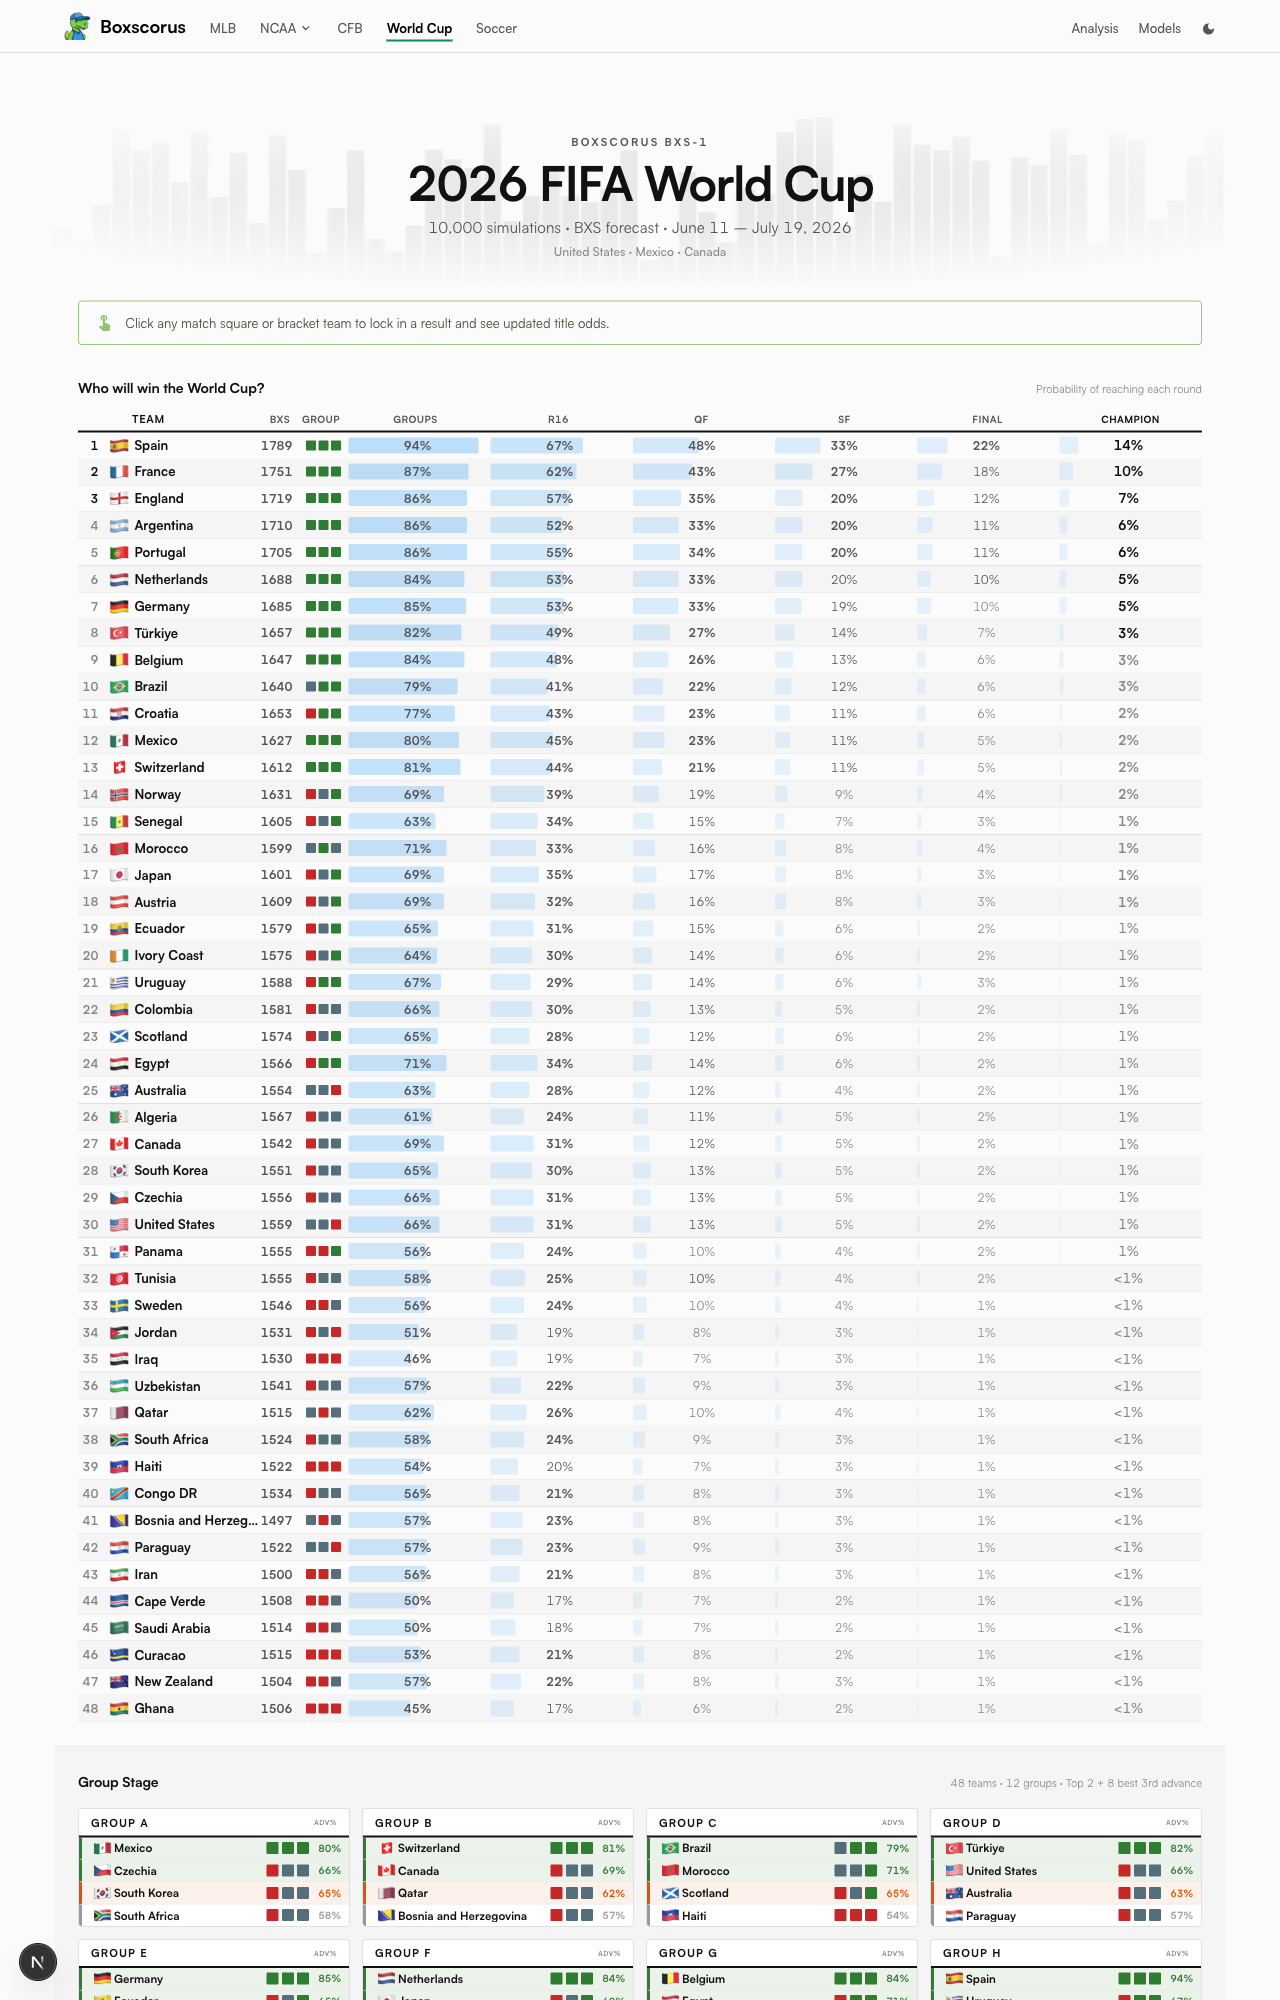
After 100,000 tournaments, the model just counts. How often did each team escape its group, reach the quarterfinal, win the whole thing? Those counts are the forecast. Here is the top of the board.
| Team | BXS ELO | Reach Final | Champion |
|---|---|---|---|
| Spain | 1789 | 20.3% | 13.5% |
| France | 1751 | 16.0% | 9.6% |
| England | 1719 | 11.2% | 6.3% |
| Argentina | 1710 | 10.0% | 5.7% |
| Portugal | 1705 | 9.7% | 5.5% |
| Netherlands | 1688 | 9.0% | 4.7% |
The real payoff is watching a single team's odds get built round by round. Spain is the model's favorite, and even Spain has to survive the whole gauntlet.
| Round Spain reaches | Share of runs |
|---|---|
| Round of 32 (escapes the group) | 93.7% |
| Round of 16 | 66.9% |
| Quarterfinal | 46.9% |
| Semifinal | 33.6% |
| Final | 20.3% |
| Champion | 13.5% |
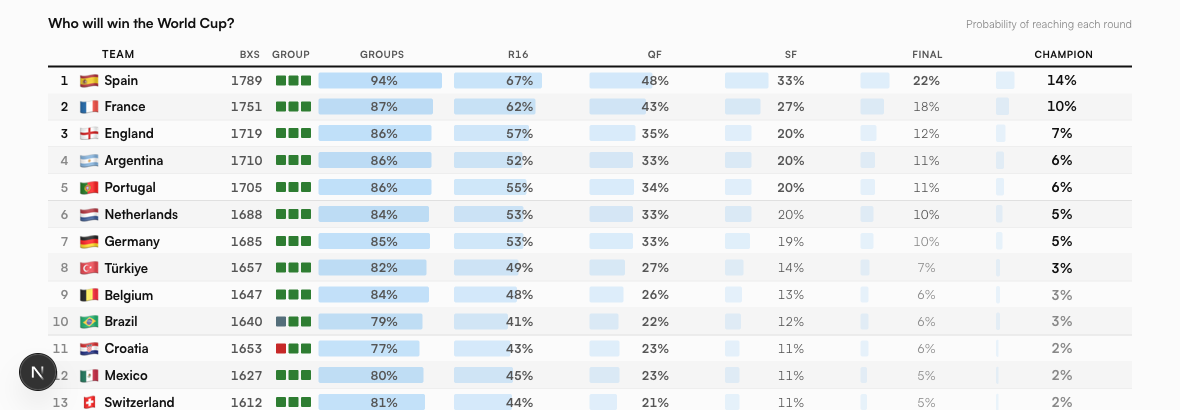
Read that path top to bottom and you can watch the gauntlet bite. Spain clears the group nearly every time. By the quarterfinal they are a coin flip. The drop from reaching the final (20.3%) to winning it (13.5%) is the last opponent taking a third of Spain's would-be trophies. A 13.5% favorite in a 48-team field is not a weak forecast. It is a strong one, and it still means 86.5% of runs end with someone else lifting the cup.
Now Change a Result
Everything above assumes no games have been played. The moment you give the engine a known result, it re-runs all 100,000 tournaments around it. That is the part worth playing with.
Go open the simulator and run your own scenarios. Lock Spain into a group-stage exit and watch their path table collapse. Hand Argentina a soft bracket. Knock out your rival and see every other team's odds shift in response. A static forecast tells you what the model thinks today. A simulator lets you ask what if, which is the only honest way to think about a tournament with this many branches.